TrainerRoad’s mission is simple: to make you a faster cyclist, whoever you are and whatever your discipline. We’ve helped tens of thousands of athletes reach their goals, but how do we do it? What makes TrainerRoad cycling’s most effective training tool?
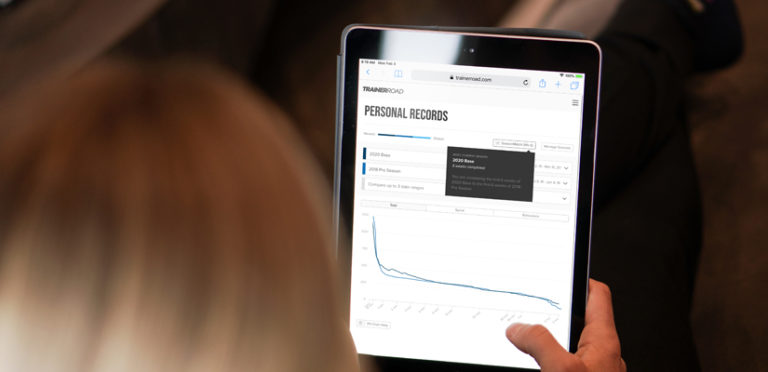
How to Use SeasonMatch to Compare PRs
Fast cyclists use effective training. But how do you know if it’s working? Using SeasonMatch to compare PRs gives you proof your training is working every step along the way, rather than waiting for your peak.
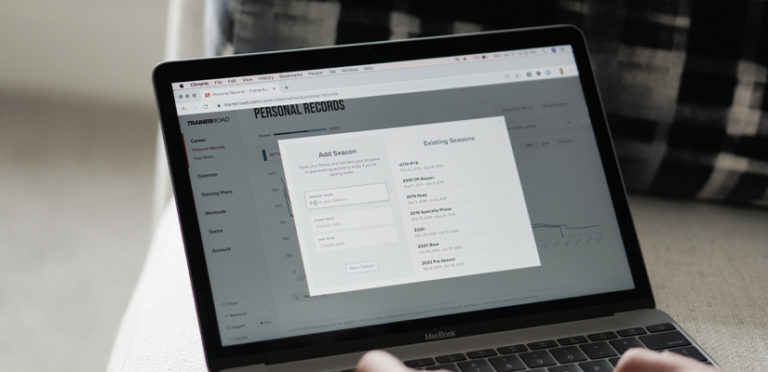
How to Use Seasons for Year-Round Cycling Fitness
Cycling seasons are unique to every athlete. With Seasons you can analyze your power PRs over custom time periods. Whether you want to compare growth over multiple years or multiple disciplines with one year, get more personal records and prove your training is working with Seasons.
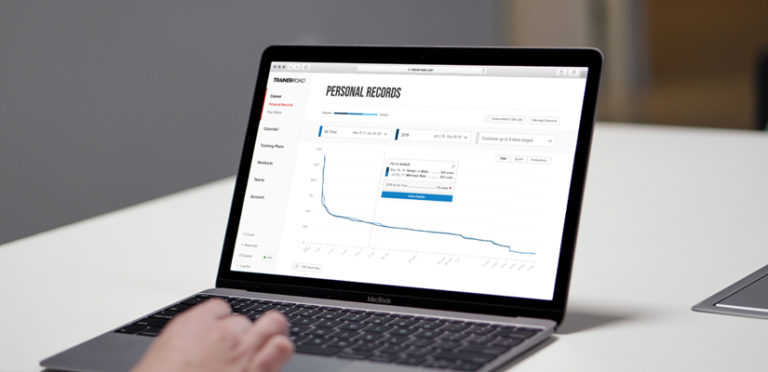
Why You Should Measure Your Power PRs
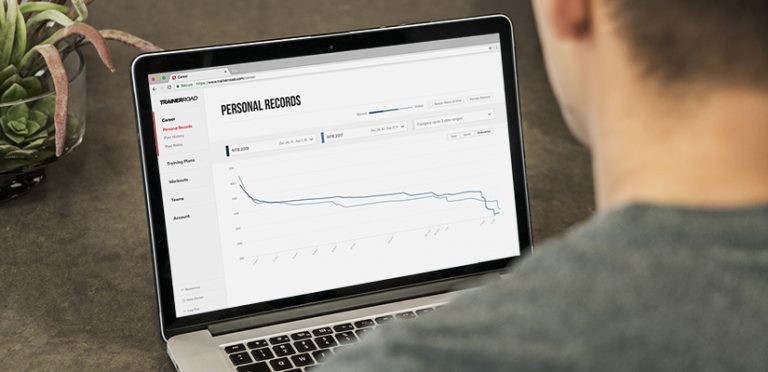
Every athlete wants effective training. But how do you know if it works? Tracking power Personal Records with Performance Analytics will reveal your strengths and prove your hard work is paying off.
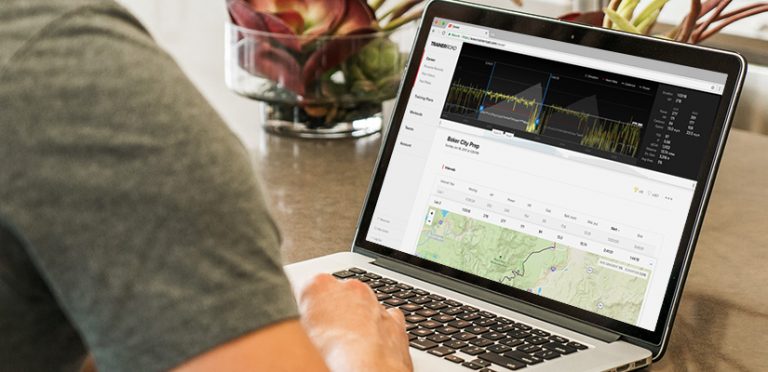
New Ride Analysis Page: How to Achieve More PRs Analyzing Your Ride Data
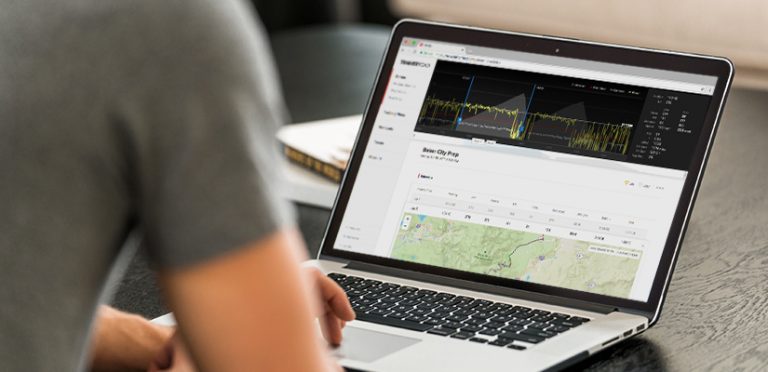
Improve your performance by analyzing your ride data with the new Ride Analysis Page. Performance Analytics, our new set of ride analysis tools, was made available to all TrainerRoad users on May 9th, 2018. We’ve already covered how to use the Training Stress Chart and Personal Records Page. Today, we’re going to dive into ways…
New Personal Records Analysis: Is Your Training Working?
Performance Analytics joins your indoor and outdoor ride data into a set of tools designed to make you faster while leaving out the bloat. This post is dedicated to Personal Records (PRs). Personal Records = Personal Wins Power-based Personal Records are my favorite kind of feedback. It doesn’t matter who showed up to the race,…
New Training Stress Chart: Track Progress and Get Faster
TrainerRoad is launching a major new feature area we call Performance Analytics. This is the first post of three where I’ll be diving into a feature in depth. This post will be dedicated to our new Training Stress chart. Process vs. Results Performance analytics is built around the concept of improving your behavior to influence…
Introducing Performance Analytics
Today I’m excited to announce a new major feature area for TrainerRoad. We call it Performance Analytics. We think that cycling analytics today are overblown, overcomplicated and bloated for 99.9% of riders out there. Our goal was to develop an easy-to-use set of tools that show you exactly what you need to become faster, while…
Performance Analytics — Feature Preview and Live Q&A
Join us for a live Q&A and demo of our new Performance Analytics features, including a new Training Stress Chart, Personal Records and SeasonMatch tomorrow at 8:00am PDT. Learn more about Performance Analytics.