When a workout doesn’t go to plan, log Heat or Menstrual Cycle in one tap. Better data in means better, more accurate workouts from TrainerRoad AI.
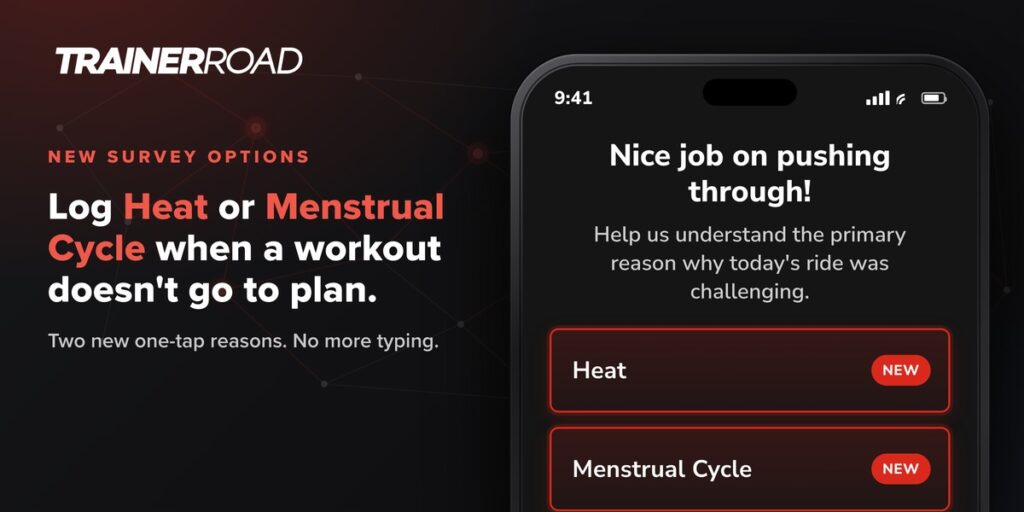
NEW: Log Heat or Menstrual Cycle on a TrainerRoad Workout
Read more: NEW: Log Heat or Menstrual Cycle on a TrainerRoad Workout