New Training Stress Chart: Track Progress and Get Faster

TrainerRoad is launching a major new feature area we call Performance Analytics. This is the first post of three where I’ll be diving into a feature in depth.
This post will be dedicated to our new Training Stress chart.
Process vs. Results
Performance analytics is built around the concept of improving your behavior to influence your results. Or in other words, what can I change in my day to day training to get as fast as possible?
Consistent Quality (Training Stress Chart)
The number one way to get faster and the number one thing that we see people struggle with is consistent quality in their training.
We’ve developed an easy to use Training Stress Chart to help combat that.
The Training Stress Chart graphs both your indoor and outdoor Training Stress, six-week average Training Stress, your FTP changes and has a super cool drill in feature that makes it easy to see what rides contributed to your Training Stress that week.
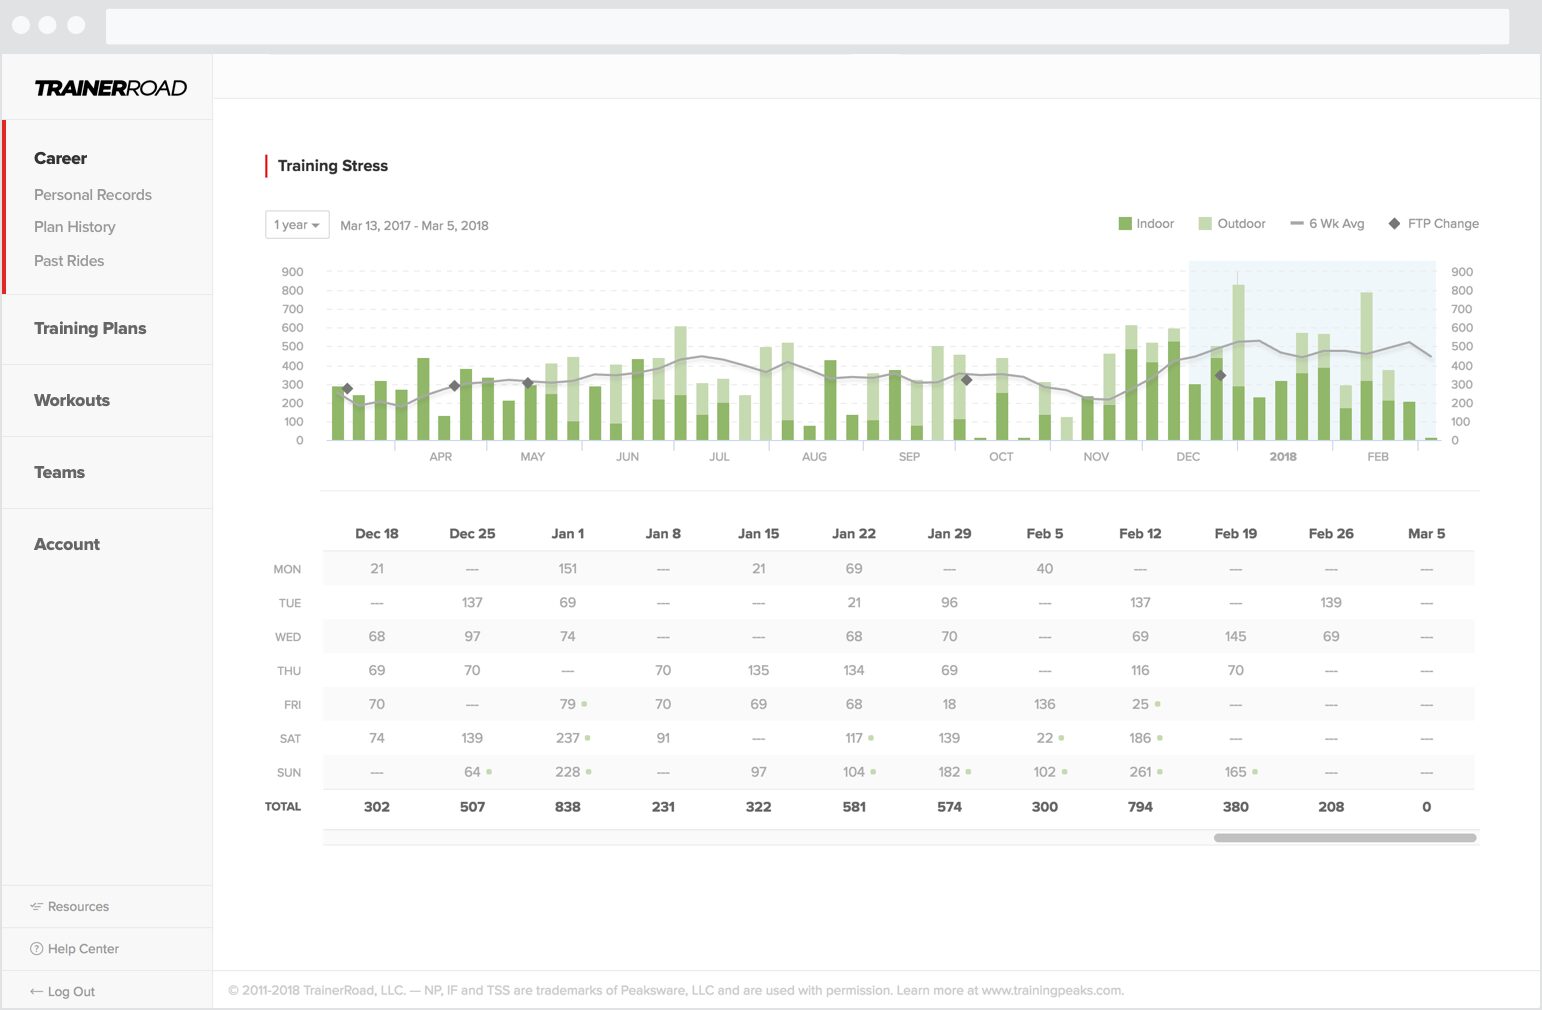
Navigating the Chart
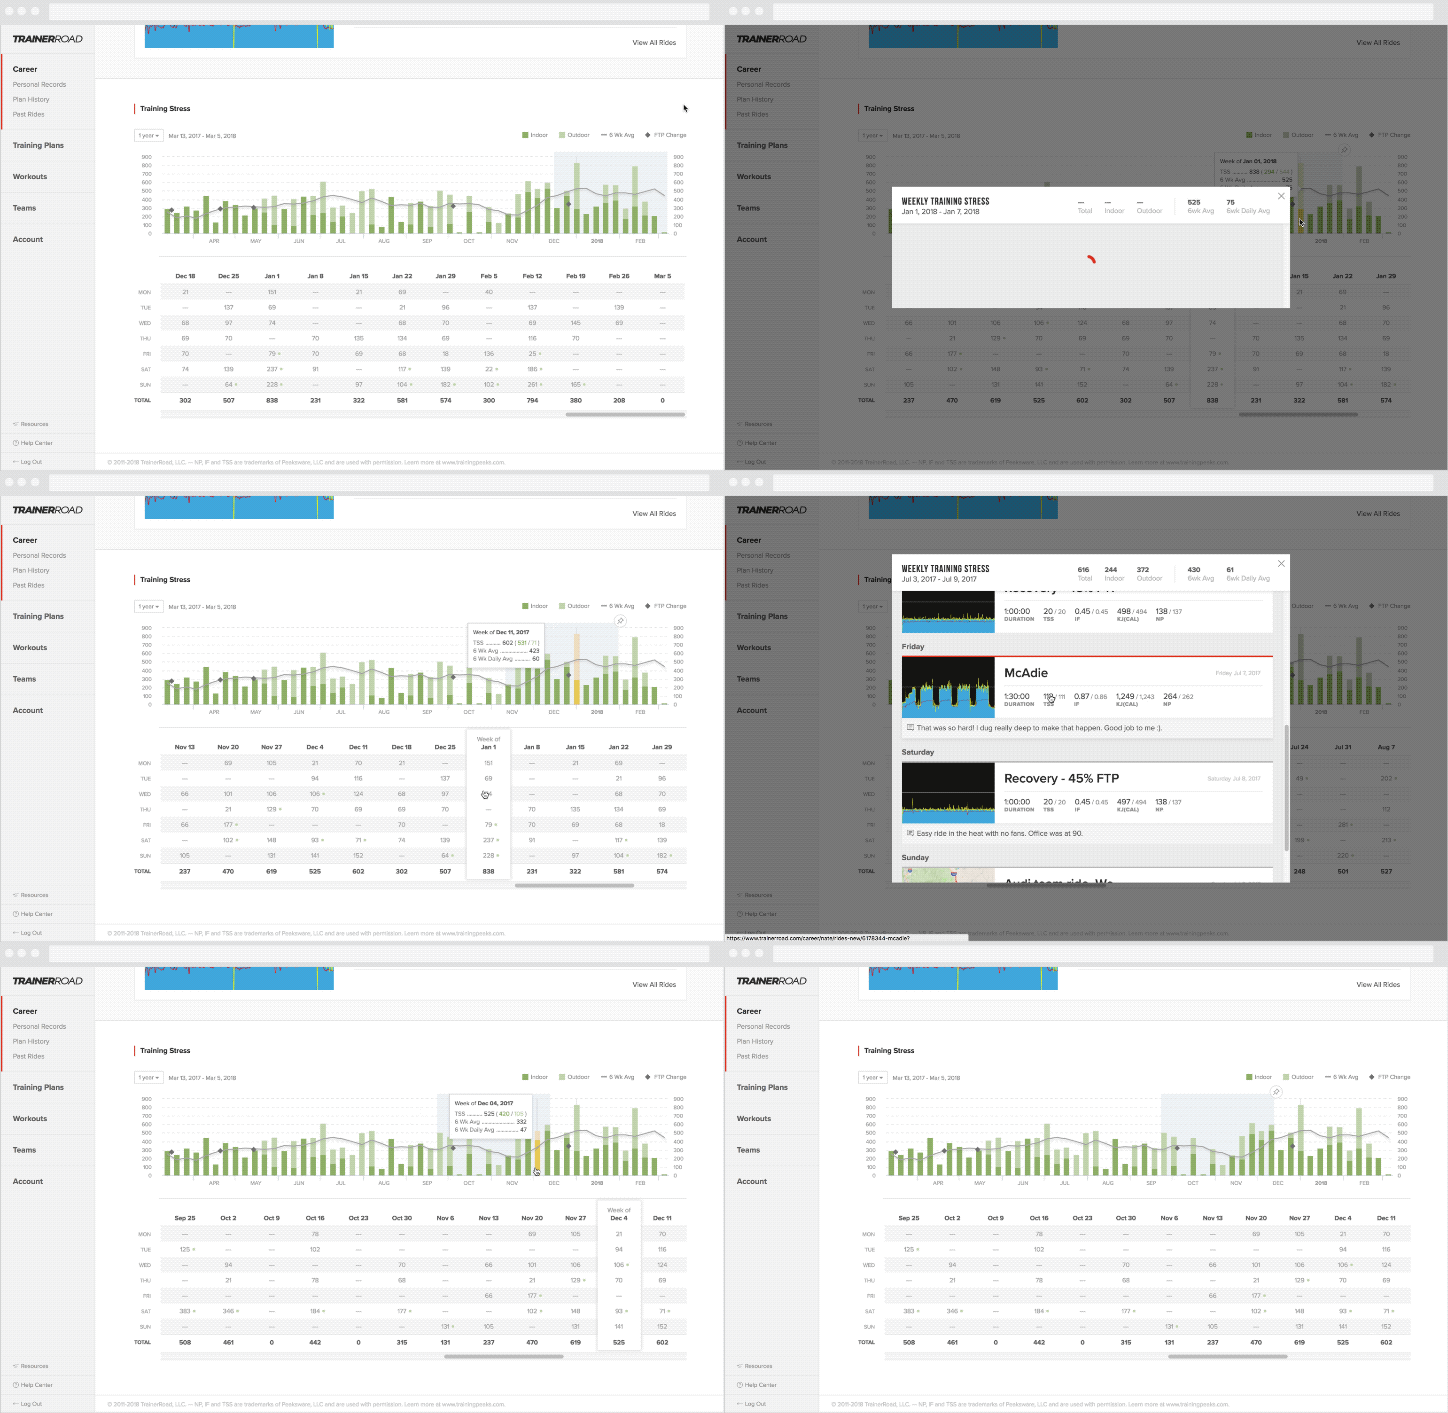
As you move your mouse over the chart, the bottom drill in detail automatically updates to reflect that period. You can then click on a week to drill in.
Identifying Problems
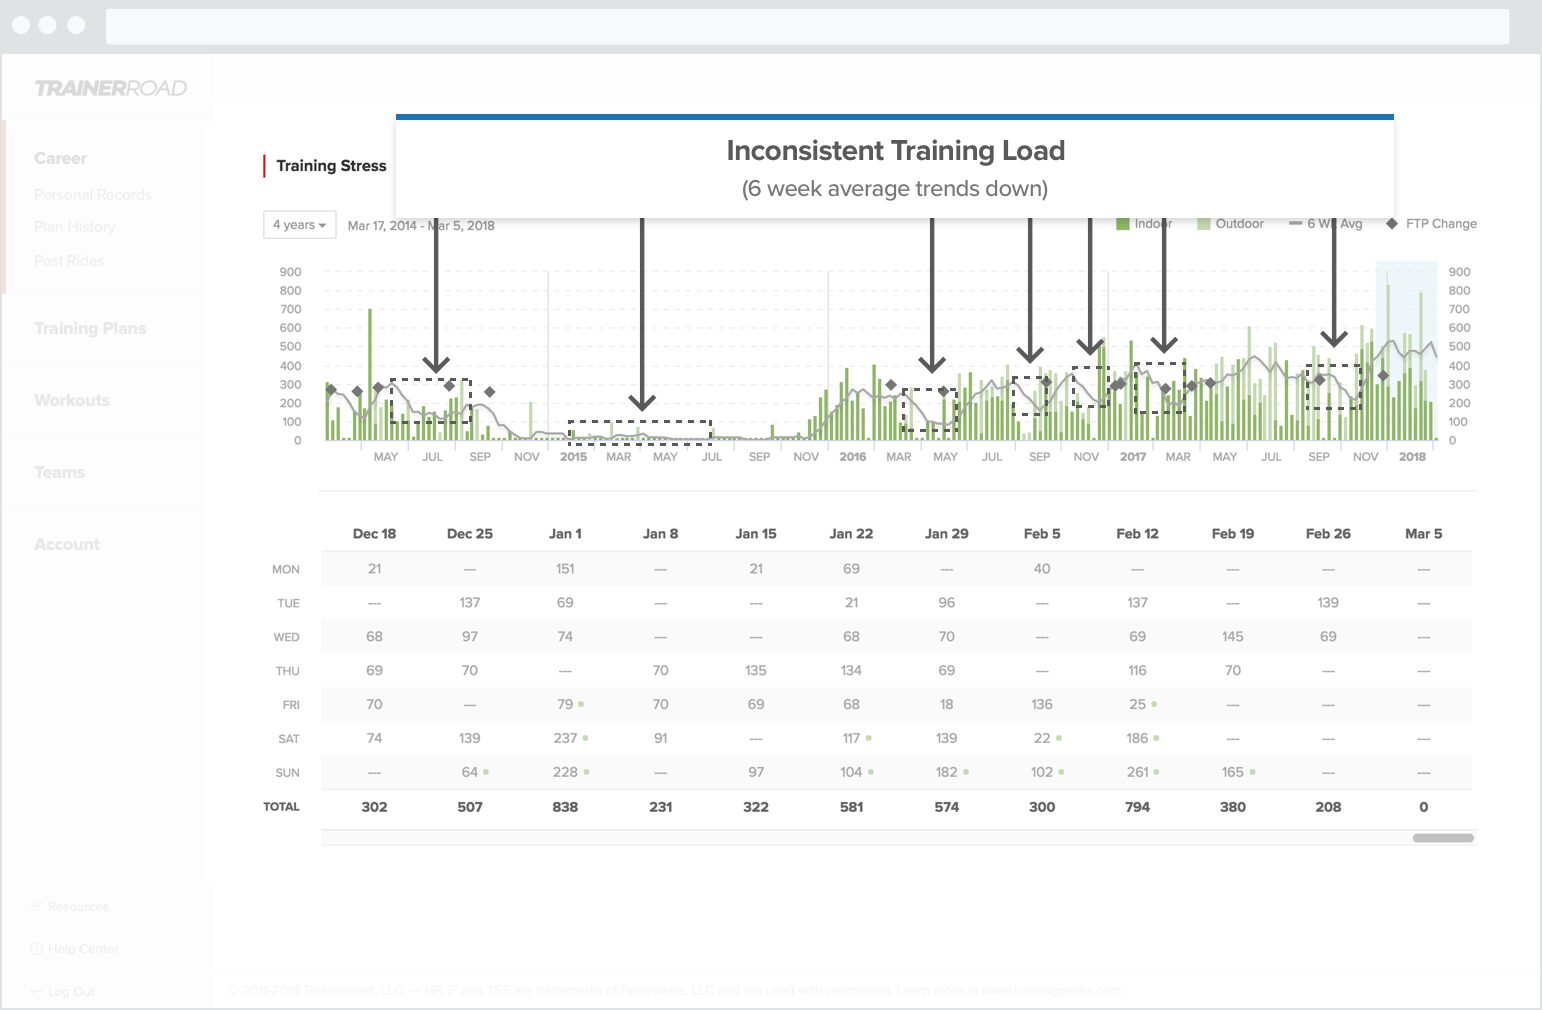
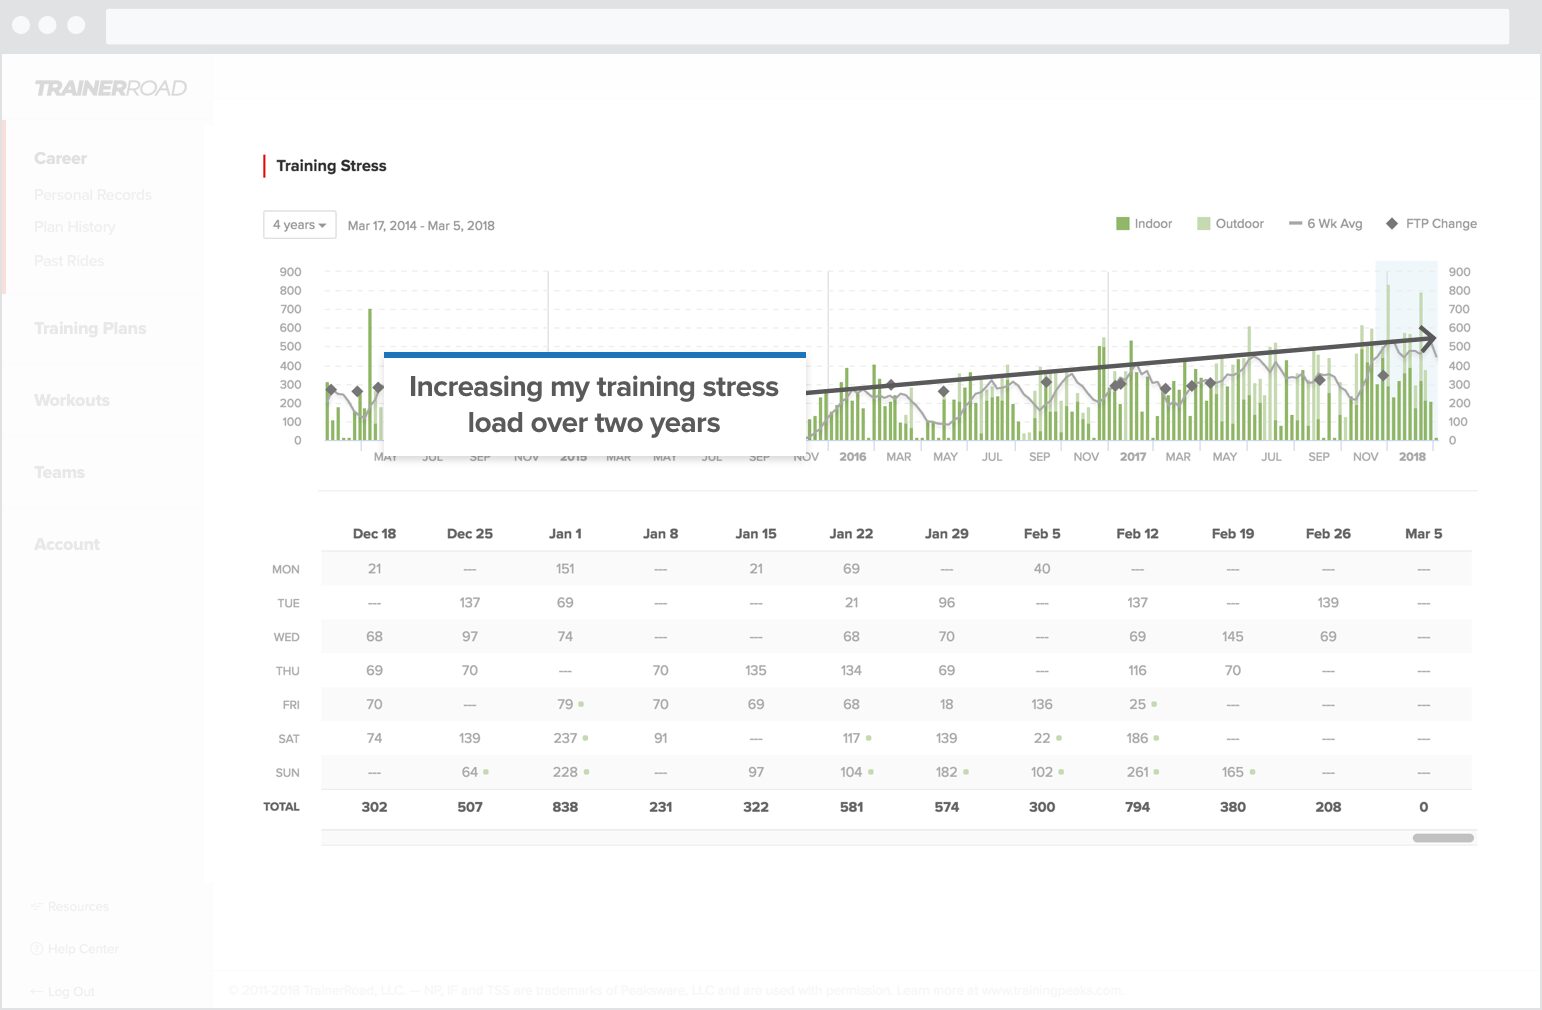
The Training Stress chart can display a maximum of 4 years of history. This view shows you where your strength and weaknesses are.
My graph shows an “up and down” consistency model which is my biggest problem (and I suspect a lot of people reading this). You can see this by following the grey six-week Training Stress line.
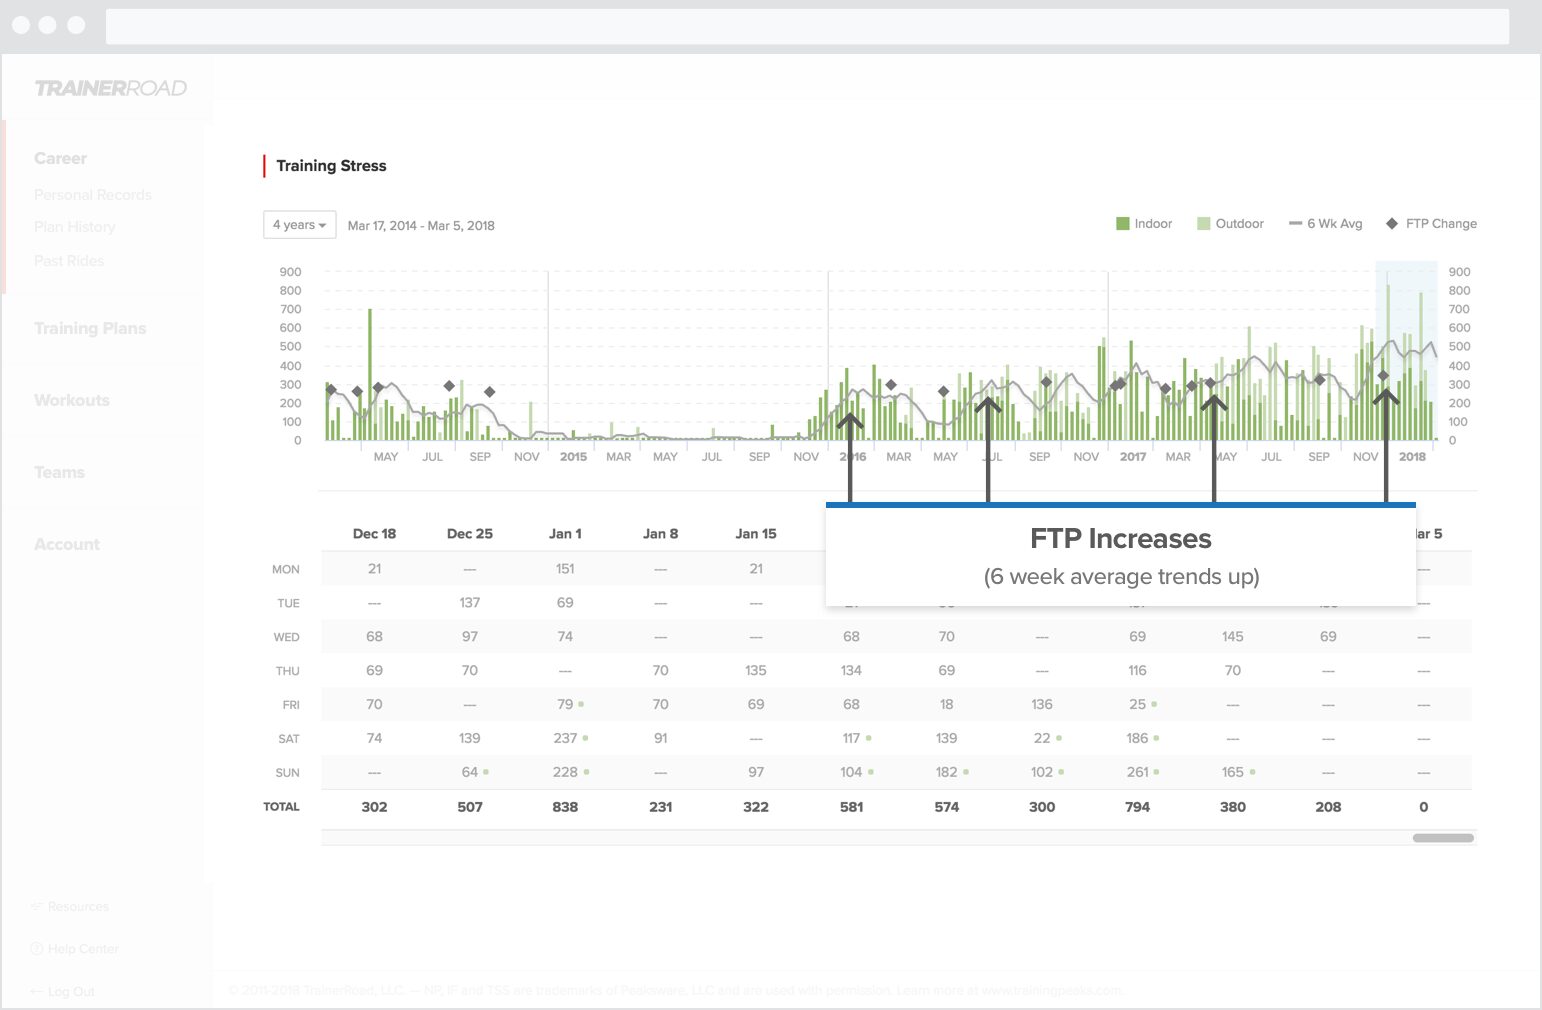
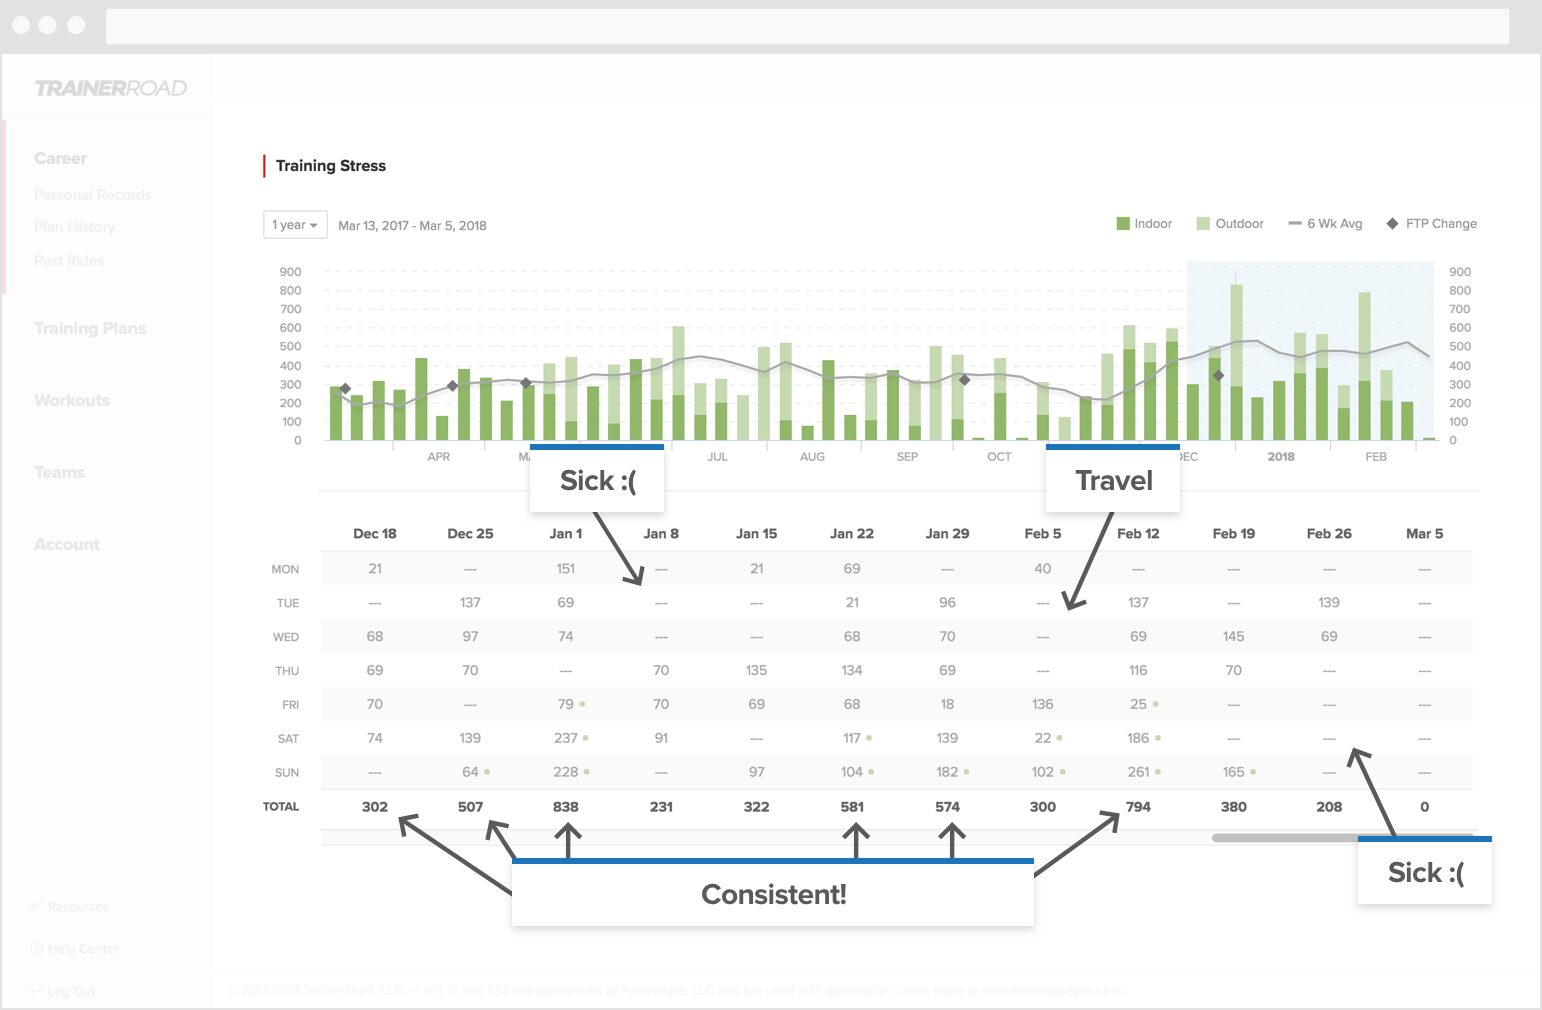
My excuses are varied (sickness, travel, surgery and broken bones) but the result is the same: when I’m consistent in my quality my FTP goes up.
Another interesting thing is that I can only ramp my training up so much before I become inconsistent. I suspect my body can only handle so much and a slower ramp would probably make me more fit in the long term.
Coming up with Process Goals
I have a personal goal to keep my six-week Training Stress line above 400 per week. Maintaining a high Training Stress goal like this is easy to do by following a mid-volume TrainerRoad plan (and it will also make sure that I peak for my A Race).
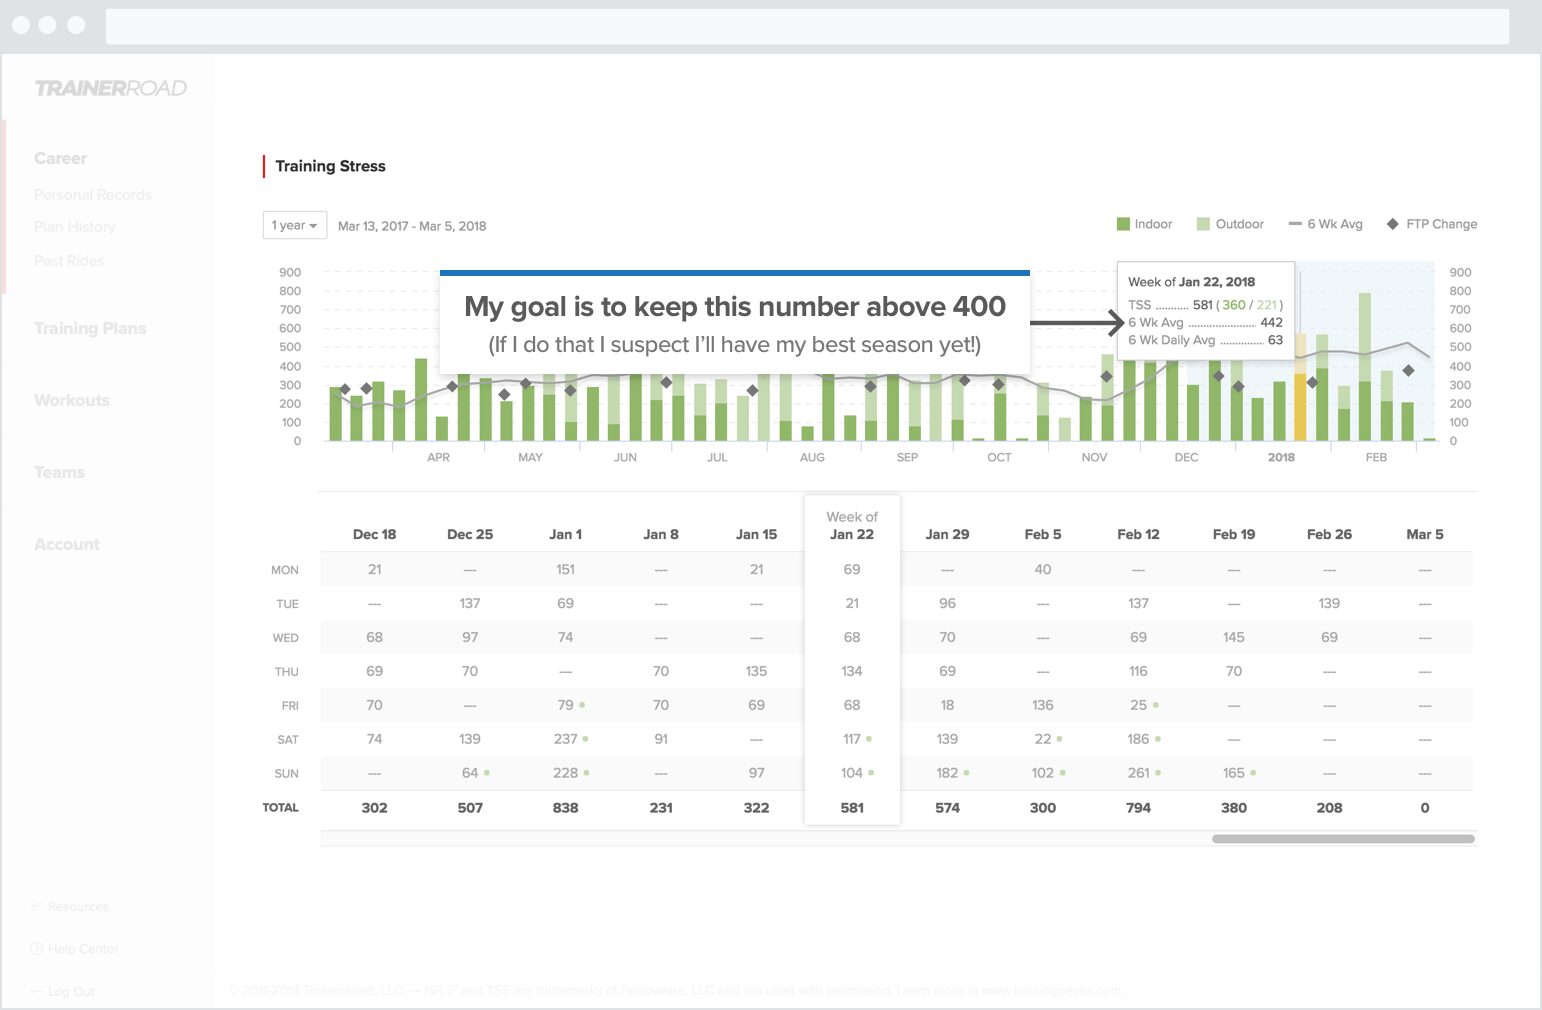
I plan on keeping my six-week average Training Stress this high until after the Leadville 100 (August) which is my second A race of the year.
The Training Stress Graph keeps me honest against my goal. It also lets me combine inside and outside rides in a single graph to better track my Training Stress.
Historical FTP and TSS
Some of you might not have four years of TrainerRoad data. Fear not! We’ve got two options for you:
- We’ve automatically put in FTPs based on your peak power outputs in the ride files we analyzed. If you’re happy with your FTP history, you don’t have to do anything.
- You can manually edit your FTP history. When you save your new FTP, we’ll kick off a job to reprocess your Training Stress for each outside ride.
TSS Chart Drill In
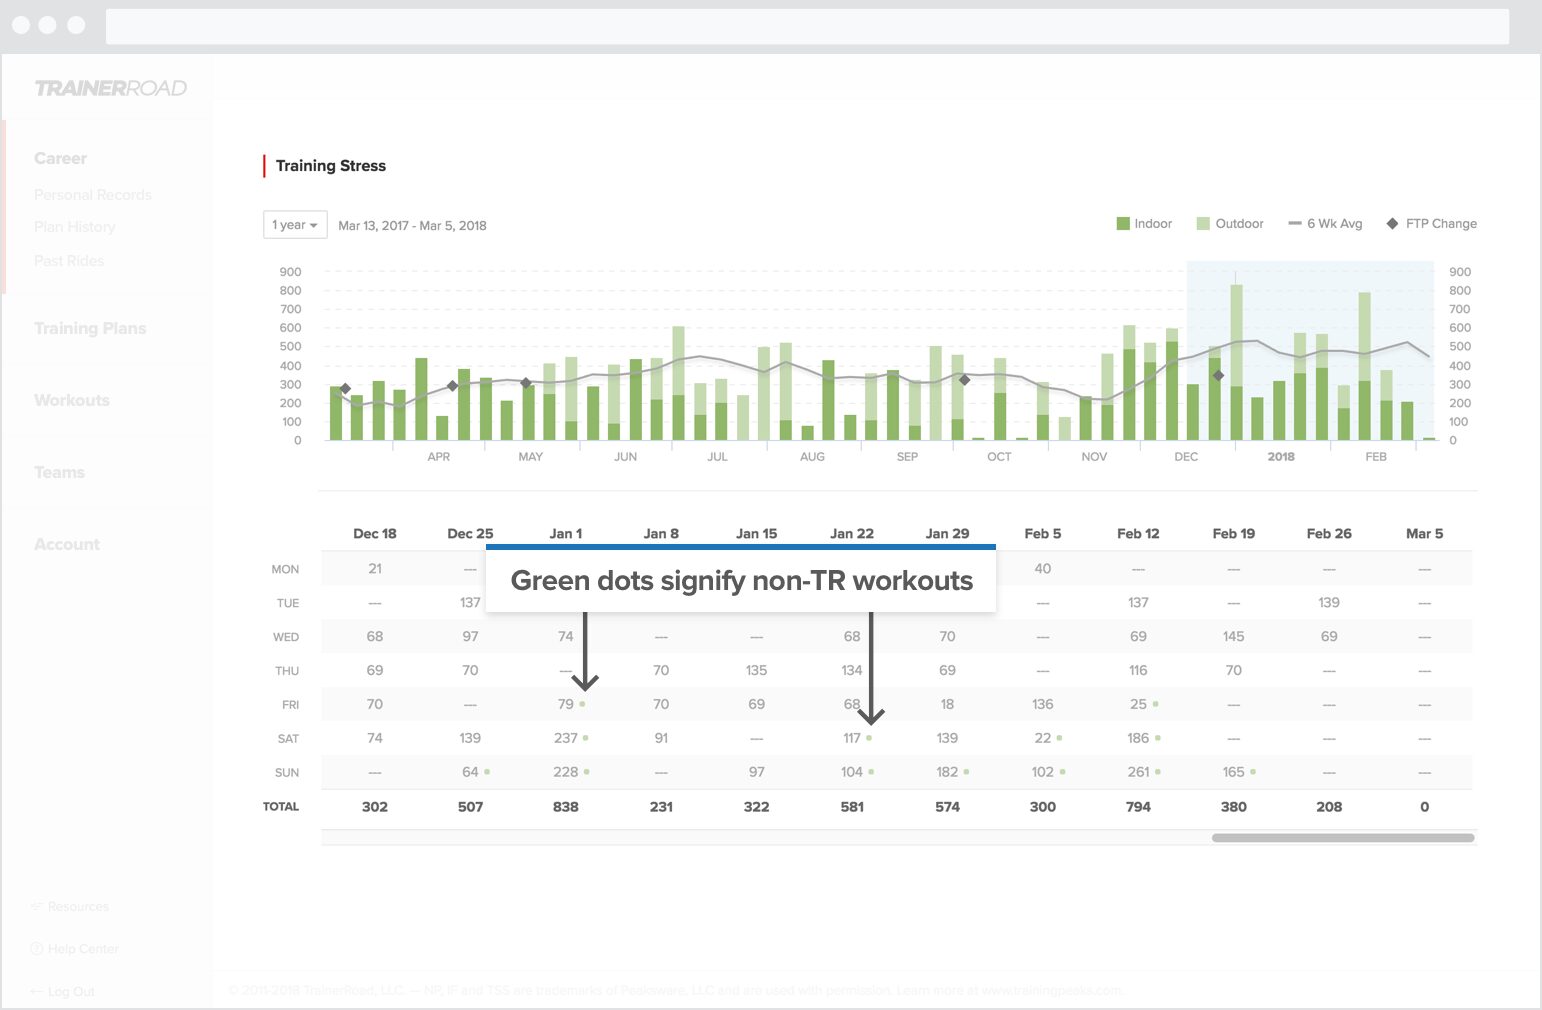
The bottom TSS table makes it easy to see how you earned your Training Stress for that week. Outside rides are marked with a green dot, and you can click on a week to view the actual rides.
Do you end up taking a week off after you do six days in a row? Maybe you should consider taking a planned rest day after every third workout to become more consistent.
Do Tuesdays always seem to get skipped? Schedule your easier, less important workouts there or have them be complete rest.
When you had your best training sets, what did your daily breakdown look like? Can you repeat this in the future?
Training Stress Estimator
We know that most people don’t have the luxury of having a power meter on every bike. We’ve come up with a great way to estimate Training Stress for those rides.
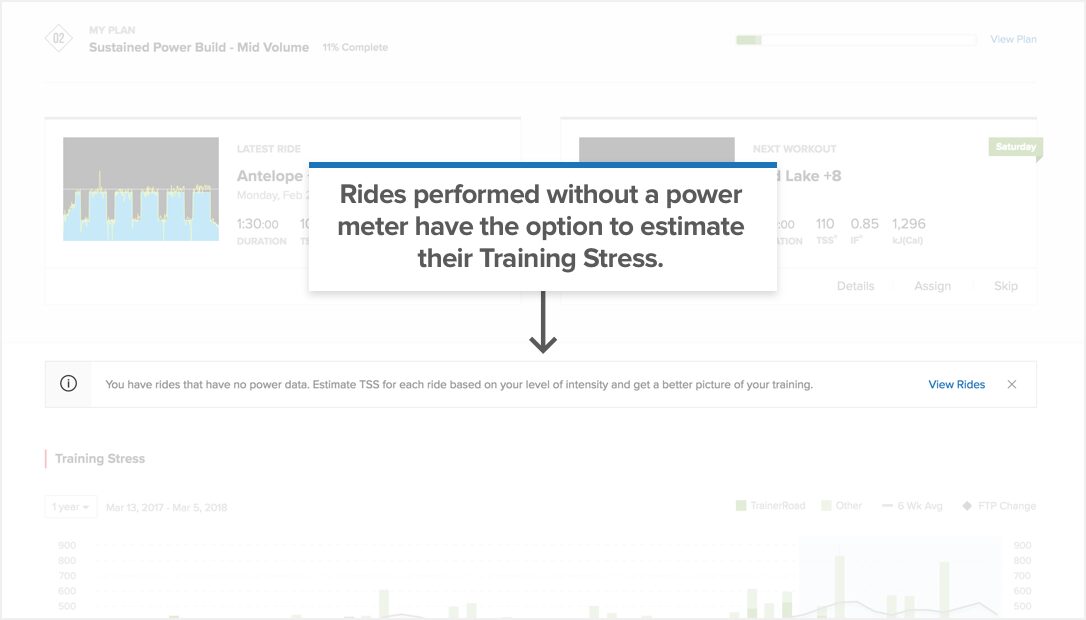
Based on beta feedback we made it easier to find those rides too. Those rides will have a notification to estimate their Training Stress in your Past Rides feed.
That’s it for now! Let us know if you have any questions.
FAQ
Can I set an indoor and outdoor FTP?
We don’t believe in having a different FTP for indoor and outdoor workouts, but we won’t prevent you from doing this either.
You can manually edit the FTP for each outside ride that comes on that ride’s page. There’s a 3-dot menu at the top of the ride page that lets you set the FTP for that specific ride.
Does the Training Stress Chart replace a calendar?
Nope! A badass calendar is next on the roadmap.
Learn More About Performance Analytics
For more information on each feature of Performance Analytics, learn more on our YouTube Playlist and Help Center: