TSS, or Training Stress Score, is a power-based metric used to quantify the amount of stress on the body from cycling activities. It’s calculated using Normalized Power, Intensity Factor, and time. TSS in cycling is also one of the most commonly misunderstood metrics in the sport, frequently interpreted to mean things it doesn’t. So what is TSS, and what is it good for?
Table of Contents
What Is Training Stress Score?
TSS, or Training Stress Score, describes how much relative physical stress a workout places on the body. Since it’s power-based, you’ll need a few things before you can calculate TSS. You’ll need a power meter and an accurate FTP.
How Do You Calculate TSS?
Training Stress Score is based on your ride’s intensity and duration. To calculate TSS from your ride data, you’ll need the duration in seconds, Normalized Power, Intensity Factor, and your FTP. Here’s the formula:
TSS = (# of seconds of the workout x Normalized Power x Intensity Factor) / (FTP x 3600) x 100
It’s tedious to calculate manually, so most people use software to find theirs. This formula means that riding for an hour at your FTP results in 100 TSS. It also means a shorter and more intense ride could result in the same TSS as a long easy one. That’s because time and intensity are included in the equation. To learn more about Normalized Power and Intensity Factor, check out TSS, IF, and Workout Levels.
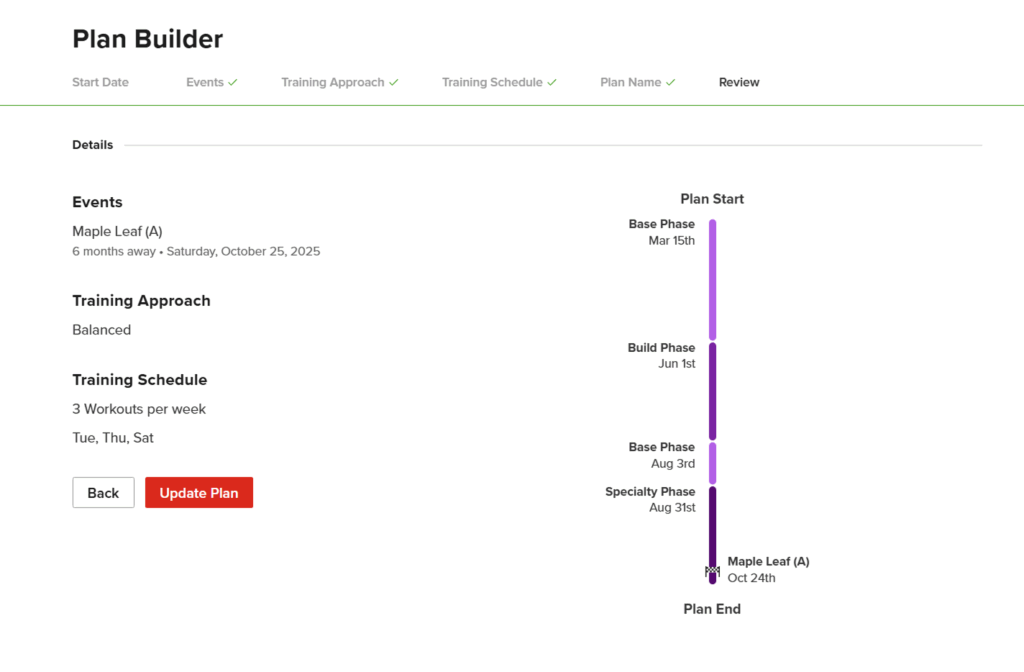
In TrainerRoad, TSS is calculated automatically for every ride with a power meter. This is used to organize training plans, as each week is designed to impart progressively higher training stress than the week before. Occasional rest weeks of much lower stress allow recovery.
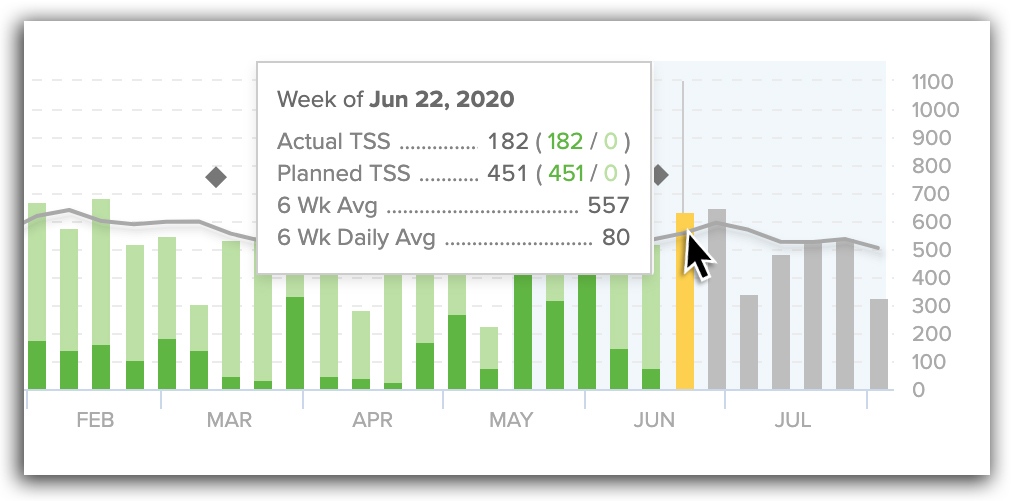
Weekly TSS is shown on the TrainerRoad calendar. Also, our Training Stress graph displays a 6-week rolling average of TSS per week as a handy visualization of your training load over time. In both instances, it’s used as a convenient marker of training. But it is only one data point to consider. To be useful, Training Stress Score must be viewed in the context of other metrics such as Intensity Factor (IF), interval duration, and time spent in power zones. These variables are all considered in the design of every TrainerRoad training plan.
What Is a Good TSS Score?
A common misconception in cycling is that an objective good TSS score for a ride exists. It’s far more subjective based on your experience and training status. For example, a beginner to cycling training using a low-volume plan may accrue 260 TSS in a week, whereas a more experienced rider might get that in a weekend. If the amount is sufficient to make them faster, it’s a good TSS score. Simply put, it’s relative to the individual and specific type of training.
How It Can Be Misleading
By definition, it’s an approximation and a simplification, so determining a good TSS score is tricky. Problems arise when riders treat it as a definitive measurement without considering other factors. For instance, consider two workouts within a sweet spot training plan. A workout with 2x 20-minute intervals can result in the same TSS as a workout with a single 40-minute effort. Anyone who’s ever ridden at sweet spot knows it gets dramatically harder as efforts get longer. In this case, the TSS calculation of time and intensity doesn’t tell the entire picture. It ignores the context of how it is generated.
A similar situation can arise during a hard training block or over a short period such as during a training camp. The first workout of the camp will almost always feel easier than those that follow. That’s because fatigue builds up over time. Even if the workouts are exactly the same amount of stress, the nominal training stress of these rides would also be the same, but the physical toll and necessary recovery would not.
Finally, TSS from rides with repeated surges often seems lower than expected. Many riders experience this in racing or hard group rides, as the stochastic rhythm of hard efforts feels nearly unsustainable. However, the overall time spent at high power in a race is usually fairly low, and the calculation makes no allowance for nuance. The low score recorded from a race might seem to imply low stress, while your legs undeniably insist otherwise.
Adaptive Training
Get the right workout, every time with training that adapts to you.
Check Out TrainerRoadHow Is TSS Used in Cycling Training?
Training Stress Score is one of several key factors used for designing a training plan. With consistent training and proper recovery, your body adapts to the stress you accrue from your workouts. This increases your work capacity and the ability to handle greater amounts of training stress. Your training plan balances adding more stress without overwhelming your ability to recover.
TSS is a tool for tracking this training load. Comparing total Training Stress Score per week is a helpful way to monitor Ramp Rate and ensure you are not doing too much, too fast. Additionally, with other TSS-based metrics, like CTL, ATL, and TSB, you can time manage the timing of your fitness to peak for your most important event.
As a way of comparing individual workouts, it is important to remember that because of how the TSS calculation includes handles duration and intensity, it can be misleading. Similar values might seem to equate the stress of two dramatically different efforts, but this is not an accurate way of quantifying how your body responds to training. For this reason, Training Stress Score is best used for direct comparison only for workouts that stress similar energy systems—sweet spot and threshold rides, for instance. However, even comparing similar rides by Training Stress Score can be dubious.
Key Takeaways
- TSS uses time and intensity to quantify the relative stress of a ride.
- TSS is most effective as a way of tracking long-term trends.
- Comparing rides by TSS can be misleading, as effort type and workout structure are not factored into the calculation.
- No metric is a goal in and of itself. High TSS does not necessarily mean high fitness.
- TrainerRoad’s Workout Levels are a newer way to compare workout difficulty.
- TrainerRoad shows your TSS, but our training plans take many more factors into account so you don’t have to.
- TrainerRoad’s Fatigue management system effortlessly manages fatigue for all of your activities.
A New Way To See the Difficulty of a Workout
Workout Levels are a metric in TrainerRoad that compares the relative difficulty of workouts within each training zone. They range from 1 to 10, with 1 being the easiest and 10 being the hardest. Thus, a Level 6 Threshold workout is significantly harder than a Level 3 Threshold workout, but not as challenging as a Level 9 threshold workout. A very few particularly challenging workouts even exceed Level 10.
Workout Levels go beyond metrics that only tell part of the story. Instead, they utilize Adaptive Training’s data-driven insights and incorporate nuanced factors such as repetition, interval length, and recovery time. The end result is a ranking of workout difficulty that is both easily understandable and based on real-world experience.
Because Workout Levels go beyond TSS, you can not only compare workouts with greater clarity, but you can now easily see your training progressing, through each training zone. For instance, a training block may start with a level 4 Threshold workout, but by the end, you’ll be completing ones at a much higher level.
Adaptive Training
Get the right workout, every time with training that adapts to you.
Check Out TrainerRoadPutting Training Stress Score in Context
TSS is just one of several metrics used to measure workout stress, and these metrics must be considered holistically to be useful. As with any other measurement, it’s meant as a tool to help quantify and enable training; it is not a goal or target in and of itself. While TSS is can be one way to help measure progress within a training plan, it should never be the singular benchmark by which workouts are designed. Properly structured periodized training challenges specific energy systems in an intentional and progressively challenging way; TSS helps express this progression but comes far from capturing the total picture.
Athletes often ask why their Training Stress Score doesn’t always increase from week to week within TrainerRoad plans, or why it decreases between training phases. These questions reflect a misunderstanding of what TSS represents and an oversimplification of how training works. After an FTP increase, your recorded TSS may actually trend downward as workouts become harder at higher power targets. In this case, a decrease in TSS does not indicate an actual decline in training stress, but is just a numerical reflection of how it is calculated and a demonstration of its limitations in showing progress.
As shown earlier in the case of interval length, workout structure is more significant and impactful than the workout’s training stress score would indicate. By varying workout designs within a training plan, we can stress the body in progressively specific and useful ways. In many cases, TSS does not reflect or express these variations, but it’s the body’s response to training that matters.
TSS From Heart Rate Data:
If you don’t have a power meter, TrainerRoad can estimate TSS using heart rate data. This method relies on your heart rate threshold rather than power to gauge intensity. While heart rate–based TSS is generally less precise because heart rate can be influenced by factors like fatigue, hydration, and temperature, it still provides a helpful estimate of training stress. You can view and track this estimated TSS in your TrainerRoad Calendar, making it easier to monitor training load and plan recovery even without direct power data. Learn more here.
TSS FAQ
What is TSS in cycling?
TSS stands for Training Stress Score.
It’s a metric to measure the training load of a ride/workout, combining both duration and intensity into a single number.
In simple terms, TSS helps you understand how “hard” a workout was on your body relative to your functional threshold power (FTP). A higher TSS means greater training stress.
How is TSS calculated?
TSS is calculated using the formula:
TSS = (Duration x Normalized Power x Intensity Factor) / (FTP x 3600) x 100
Where:
- Duration = ride time in seconds
- Normalized Power (NP) = an adjusted average power reflecting variability in effort
- Intensity Factor (IF) = NP divided by FTP
In simpler terms:
- 100 TSS points equals 1 hour at your FTP.
- 50 TSS points could be an hour at half your FTP, or 30 minutes near FTP.
TrainerRoad automatically calculates TSS for every workout, indoor or outdoor, so you don’t have to do any math. TrainerRoad also makes it easy to manage training load across all activities with the fatigue management system[learn more here].
Is there a good TSS score?
TSS, is simply a measurement for training stress. So A good TSS will be different depending on what you are trying to do. A lower TSS is good for a recovery ride, a moderate to high TSS may be good for training.
As a rough guideline:
- 50–75 TSS: Moderate/challenging effort
- 75–100 TSS: Hard ride/very hard effort
- 100–150+ TSS: Very demanding ride or race effort
Your weekly TSS is also important as it can help you to see accumulated fatigue. TrainerRoad plans are carefully structured to balance weekly TSS accumulation and recovery so you continue progressing without overtraining. If You do an extra hard day, TrainerRoad has your back to help you manage that training load with fatigue management[learn more].
Is TSS accurate/useful for all types of rides?
TSS is a useful benchmark but has limitations:
✅ Most accurate for power-based cycling workouts
✅ Reasonably accurate for steady-state endurance rides
❌ Less accurate for:
- Strength training
- Running or cross-training
- Very short, high-intensity efforts (sprints)
- Rides without a calibrated power meter
This is why TrainerRoad combines TSS with IF, Fatigue Management, FTP Detection, subjective surveys, and workout progression tracking—so your plan adapts to your real fitness and fatigue, not just a single number.
How TSS Relates to IF, CTL, and ATL
TSS vs. IF (Intensity Factor)
- TSS (Training Stress Score) measures the overall training load of a workout by combining both duration and intensity into a single number.
- IF (Intensity Factor) measures how intense a ride was relative to your FTP, without considering duration.
Example:
- A 1-hour ride at your FTP has an IF of 1.0 and a TSS of 100.
- A 30-minute ride at FTP still has an IF of 1.0 but a TSS of 50 because it was only half as long.
Key takeaway:
- IF tells you how hard you went relative to your capacity (FTP).
- TSS tells you how much stress you accumulated combining time and intensity.
TSS vs. CTL/ATL (Chronic and Acute Training Load)
- CTL (Chronic Training Load) measures your long-term training load, usually over the past 42 days. Think of it as your “fitness.”
- ATL (Acute Training Load) measures your short-term training load, typically over the past 7 days. Think of it as your “fatigue.”
How they work together:
- TSS is the building block: each workout adds TSS points to your weekly and monthly totals.
- As you accumulate TSS over time, your CTL rises (showing increased fitness), and recent TSS drives ATL (showing accumulated fatigue).
Example:
- Doing high-TSS workouts for several weeks steadily increases your CTL, reflecting higher fitness.
- A sudden spike in TSS (like a big training camp) will cause ATL to rise sharply, indicating fatigue that may require recovery.
✅ TrainerRoad Simplifies This:
TrainerRoad tracks your TSS automatically and uses features like Fatigue Management (Red Light Green Light) and Dynamic Workout Recommendations to help you balance training stress, avoid overreaching, and keep improving.
How does TrainerRoad manage TSS and fatigue?
TrainerRoad manages TSS and fatigue through several key features:
- Dynamic Workout Recommendations: Your workouts automatically adapt in response to your performance and training stress.
- Fatigue Management(Red Light Green Light): TrainerRoad analyzes your recent training load and shows if you are fresh, approaching fatigue, or need recovery.
- AI FTP Detection: Keeps your FTP updated so TSS stays accurate over time.
- Cross-Training Tracking: You can add runs, swims, hikes, and strength training to your calendar—TrainerRoad includes this activity when assessing your overall training stress.
- Recovery Weeks: Plans are periodized to include recovery phases so you absorb training load, avoid burnout, and keep training consistency.
These tools work together to keep your training sustainable, productive, and personalized.
In Conclusion
We all feel tempted to oversimplify our training, and imagine that one number or bit of data offers the key to perfect fitness. In reality, training stress and how the body responds is incredibly complicated, subjective, and dependent on many factors. Training Stress Score is one tool for quantifying workouts, but good training plan design is far more nuanced than a single number can describe, and TrainerRoad takes care of this complexity for you. Trust the process, listen to your body, and let the results speak for themselves; TSS is just a number to help you get there.
✅ Need help building a plan or understanding your TSS?
For more cycling training knowledge, listen to Ask a Cycling Coach — the only podcast dedicated to making you a faster cyclist. New episodes are released weekly.