![]()
![]()
@davidtinker has Strava’s changes (announced today) affected the intervals.icu platform in any way?
No problems so far. Intervals.icu only displays segment names matched to intervals under the ride timeline chart. And that has been working only some of the time for a while because Strava sends me notification of new activities before the segments have been calculated. So now that will only work for Strava subscribers. If you have an activity you want to see segment names for intervals for click “sync with Strava” and they should show up.
But there is no change in how you pull just a normal ride from Strava? So the flow from my Edge unit, to Garmin Connect, to Strava, then to intervals.icu still works just as it always has, correct?
Yes correct.
Hey @davidtinker I just wanted to thank you again for the application. It’s absolutely fantastic for us data-driven nerds. I’ll send you a couple of $ for supplying the app fo us. Take care man!
This is a great tool!
I have been struggling with TR performance history being distorted by power spikes either due to rocky descents or simple battery drain. If intervals.icu can correct for this (I tried Golden Cheetah but that gave me a headache - the automated algorithm didn’t seem to apply my power curve and the alternative was to make individual edits - I probably have not understood GC well) is there any way to bring the corrected data back into TR dataset and personal records?
Also, there was a mention of TIZ including Sweet Spot percentages that were on top of tempo and threshold instead of wrapped in between. Is there any way to achieve this? I think the current way of presenting TIZ data for someone wishing to differentiate between SS and TH power isn’t ideal.
Keep up the good work!
David, I think it’s great and my go-to app.
thank you for creating it.
Cheers,
JC
Thanks!
Intervals.icu should flatten out those power spikes automatically. You should fill in your historical FTP as that is used as part of the “is this a spike” algorithm. Rides that have spikes are indicated as such with a little orange bolt marker on the calendar. Unfortunately I don’t think there is any way to get the data back into TR or Strava.
The SS zone is outside of the others and overlaps temp and threshold by default i.e. if you add up the percentages it will come to more than 100. You can edit the zones in /settings and make sweet spot whatever you like. Not sure if that helps?
Oh no! Why are you doing this to me @davidtinker?
FTP +19 to 319w from 14m at 343w
This will really hurt in training! ![]()
![]()
Anyway. Previous estimates seemed spot on. This one surprised me a little.
This is awesome!
This is the best tool I have ever used for my training. Thank you so much for putting this together & continually improving it
What does the “power @152bpm” for a specific workout signify, and why is the heart rate 152? Should this be tracked over time? If so, is there a way to graph this?
Thanks David. If Intervals.icu makes the spike corrections automatically, can I export the activity into GPX/TXC file and upload to TR/Strava manually? This doesn’t happen often but the odd activity with power spikes substantially distorts the sprint end of my TR power curve.
The SS on top is more a minor nuisance than a problem. If there is a way to incorporate it in between the other zones that would be great.
Thanks again!
This is your heart rate at the top of HR Z2 (endurance zone)
Intervals.icu doesn’t support export of activities at the moment. I think I would need to add manual upload first.
I can’t put SS between the other zones. Its “hardcoded” to be outside. You can speed up software dev a lot by being opinionated about stuff and Intervals.icu is quite opinionated about this.
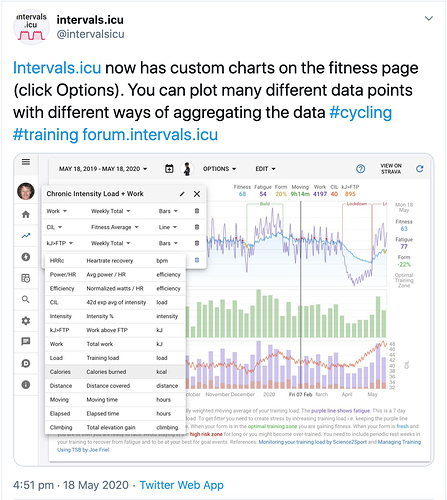
Not yet but there will be soon. Doing lots of work on custom charts and plots right now and that is definitely on the cards.
The new custom charts are really cool! But it would be nice to be able to make each line/bar/dot a custom color. A couple of times I made a chart and 2 of the fields were given the same color so it made it a bit difficult to differentiate.
That’s fantastic, thank you. I was hoping to see the same thing. I guess it can be inferred that if you FTP goes up X watts, your watts at .7% of FTP will go up a similar (identical haha) amount, but HR is a little different.
I will say that for me, my HR hasn’t necessarily followed this trend until lately.
My Z2 HR & Power target for years prior had been 136 beats for 190 watts. On the intervals.icu chart it shows I did an interval of 72 minutes (out of 180) at Z2 but my HR was 128 for 222 watts. Another shows 248 watts with an average HR of 135. Clearly my fitness is way up this year, would be very interesting to see that represented graphically. Thanks again for all you do on this!
@davidtinker When looking at the avg speed for a ride, or interval during that ride, intervals.icu only shows me whole numbers without any decimals. Is there a way I can at least see 1 decimal?
